
Time is Money
In 1748 Benjamin Franklin wrote in an essay titled Advice to a Young Tradesman, Time is Money. This maxim was as relevant then as it is now as we apply pressure on our web development teams to deliver not only high functionality websites but also ever faster websites. To achieve this developers are implementing proven best practices, such as image compression, content delivery networks and techniques to avoid render blocking to meet an almost insatiable demand for fast loading content to improve the user experience.
The complexity of the technology required to deliver fast websites means that numerous different causes exist of why user experience can be impacted through slow loading or slow responding webpages. Even though considerable effort is expended in optimizing the speed of loading of webpages, the potential impact a slow network connection can have is often overlooked.
This may be because we develop websites on fast desktop devices connected through fast network backbones to the internet or pre-delivery testing does not include proving performance non-functional requirements (NFRs) across all network speeds and device platforms.
Unfortunately the end result is not as envisioned, except for those connected with the fastest devices on the fastest networks!
In this article we look at what happens to user experience when networks slow down or fast network coverage is not available at all.
What Devices Are Used to Access Websites
Network issues are experienced generally by smart devices, such as tablets and smartphones that are connected through the cellular networks, and are rarely experienced on devices connected on cable connections.
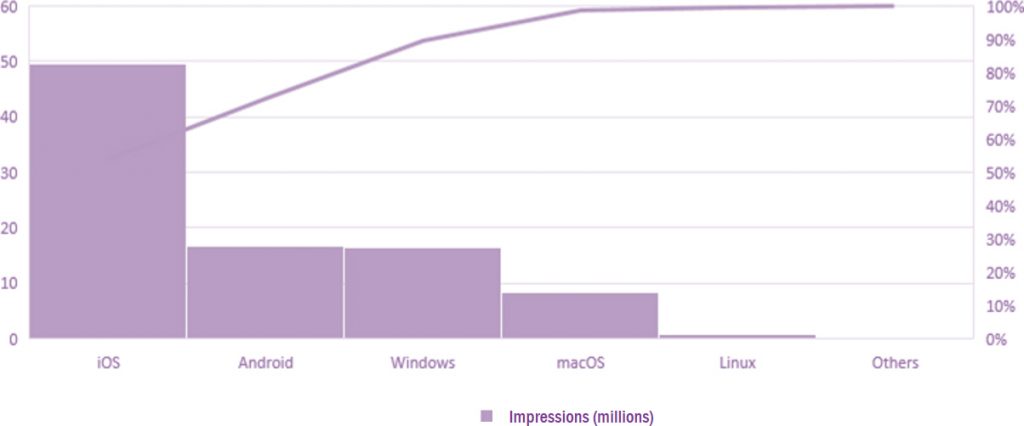
An overview of the extent of the potential problem that exists is shown in Figure 1 the chart shows the breakdown of about 100 million page impressions, organised by operating system (OS). The breakdown shows that over 65% of traffic occurs on smart devices (IOS and Android). These devices will be connected by either cellular network or Wifi.
Of these smart devices, three-quarters of them are running IOS with only 25% of them Android.
This breakdown confirms why many website owners consider the Apple IOS market as one they should be targeting as it is possibly their most lucrative.
The Mobile Marketplace
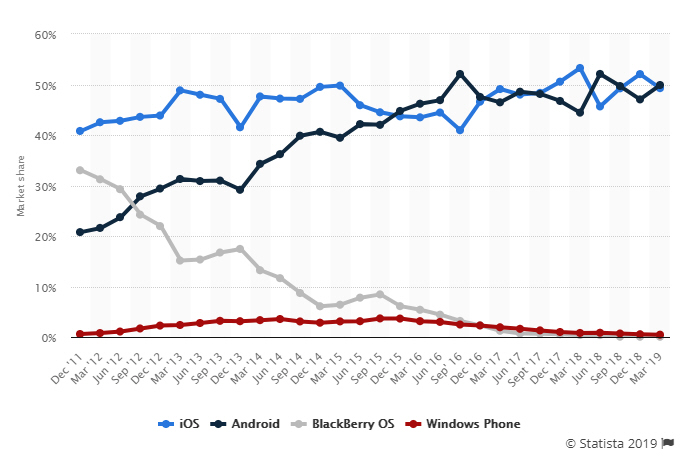
However, when we look at the market share of IOS against Android devices a different picture emerges.
Figure 2 shows that over time in the UK the share of Android devices has risen to be on a par with IOS devices and since 2015 market share has been similar in number. In the same period the competitive OS devices have fallen away leaving only IOS and Android.
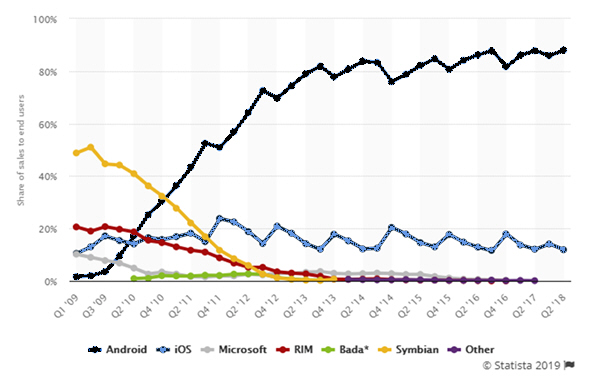
The global market is significantly different though. Figure 3 shows how Android devices has had a dominate market share of 80% for the last 6 years.
This skew is affected by the high number of Android devices in third world countries where price can be a key factor in the purchase, consequently, many of these devices may not be feature rich or very powerful in CPU and network connectivity.
Historically Apple’s IOS-based devices have had a significantly higher performance capability than Android phones and it is only recent editions of Android phones, such as the Samsung Galaxy S9 and S10, that some degree of competitive performance has been delivered. However, recent Apple announcements (June 2019) have re-established the performance superiority of Apple’s IOS-based devices.
Even though faster devices are being continually brought to market, these faster devices are in a minority compared to the high number of Android devices in use today.
Consequently, it is not unreasonable to consider that a considerable latent demand may exist of Android users if they are able to connect and utilise websites at acceptable speeds.
Cellular Network Advancement
As the demand for newer and faster smart devices continues, so has the need for the rapid evolution and improvement in cellular network speed and availability.
Proposed as an original idea by Bell labs in 1947 to develop an hexagonal cellular network it was not until the late 1970s before technology advancement allowed for the development of a commercially viable opportunity. This manifested itself as an analog-based service and was effectively the first generation (1G) of mobile telephony. It is in the 1990’s, termed as 2G, that full digital services became a reality.
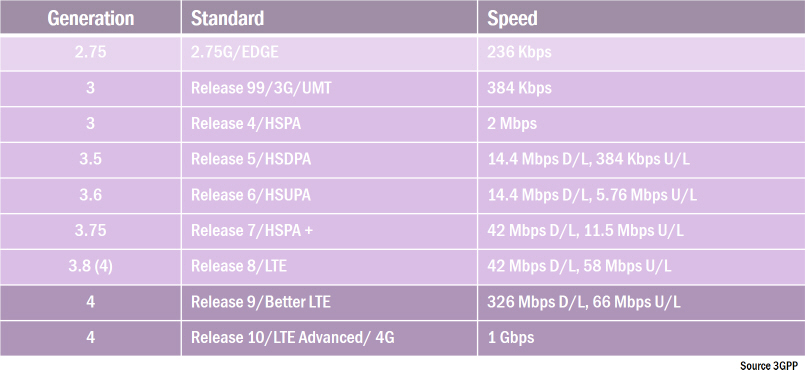
Since then we have seen many iterations and developments of the standards, (Figure 4) that ensure a common approach to ensuring effective communication services are delivered. Whereas these technical advancements have been successful in driving communications services on a global scale fast, the advent of the fifth generation, 5G, technology is now being delivered with pilot programmes being conducted in many different countries.
Figure 4 shows how the standards have evolved and the theoretical network speeds associated with each standard.
We use smart devices for so many different things now but it is interesting to see how far and fast these developments have brought us and is easy to see why expectations of instant response are demanded.
What is a Good Connection Speed
The use of raw download bandwidth is a blunt approach on defining how to view the performance of a network service. Advertisements by network providers talk about the fast download speeds of 50 to 300 Mbps as the primary reason to buy their services and the faster the bandwidth, the more expensive it should be.
Data Bandwidth, is the bit-rate of a data transmission media, and is represented as bits-per-second (bps). In English this means how much data is sent in a second. So 50 Mbps means 50 million bits per second. It takes about 5 Mbps to stream a film in HD on Netflix, so we can see that 50 Mbps is a considerable network bandwidth speed.
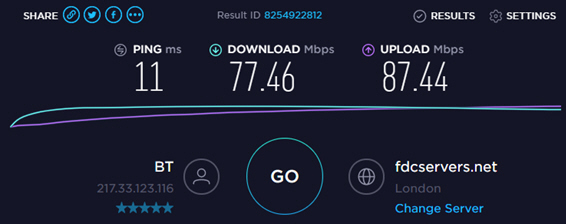
On my office desktop Figure 5 shows that I receive a pretty good service as the speed test, (speedtest.org) shows a 77 Mbps download speed and a very impressive upload speed of 87 Mbps.
At this level of service an instantaneous response could be expected for a webpage to load. Looking at the maths, the median transfer size of a webpage, (source: httparchive June 2019) is 1.9 MB and a download speed of 77 Mbps can deliver 9.6 MB per second. However, actual webpage responses can take seconds to complete, so there are other factors affecting the load of a webpage that we must be aware of.
Looking at Latency
Latency is the delay that data experiences as it makes a round trip through the network. It is measured in milliseconds and for a webpage resource is the time taken for a request from the client browser through the network to the webserver and back again.
| Generation | Typical Latency |
| 2G | 500 ms (0.5 seconds) |
| 3G | 100 ms (0.1 seconds) |
| 4G | 50 ms (0.05 seconds) |
| 5G | 1 ms (0.001 seconds)* |
Figure 6: Latency standards by Network Generation
Each of the cellular networking standards sets out the requirements for latency that should be met and as Figure 6 shows, the expected latency has been substantially improved on in each new standard.
Consequently latency is a key component that contributes to network performance.
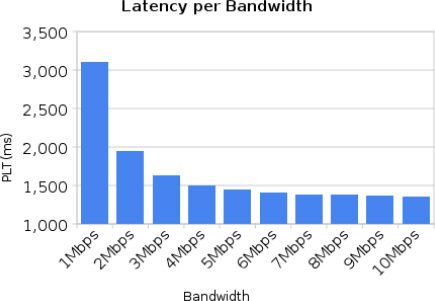
In 2009 Mike Belshe, a computer scientist with Google, investigated the impact of latency on performance. His paper, More Bandwidth Doesn’t Matter (much), documents that by maintaining a constant latency of 60 ms while increasing bandwidth against 25 selected webpages shows a minimal reduction in page load time (PLT) occurs from about 5 Mbps. Figure 7 shows his published results.
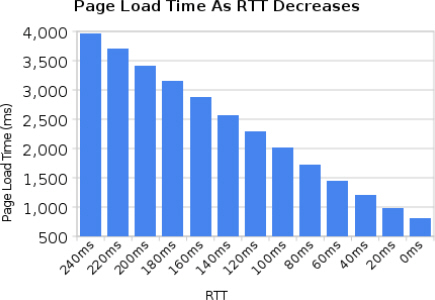
However, in a second set of tests on the same set of candidate websites he set the bandwidth at 5 Mbps and progressively reduced the latency. Figure 8 shows a linear progression of improvement was observed for page load time. He concluded from this is that lower latency will improve webpage performance.
The Truth is Out There
However when we get away from the fibre, cable and Wifi connections and we become reliant on cellular networks a different level of experience is received. Cellular technology is unable to deliver consistently high performance, such as 77 Mbps download speeds and although the specifications document the theoretical capabilities of the technology, the delivery speeds are rarely delivered and service levels are inconsistent.
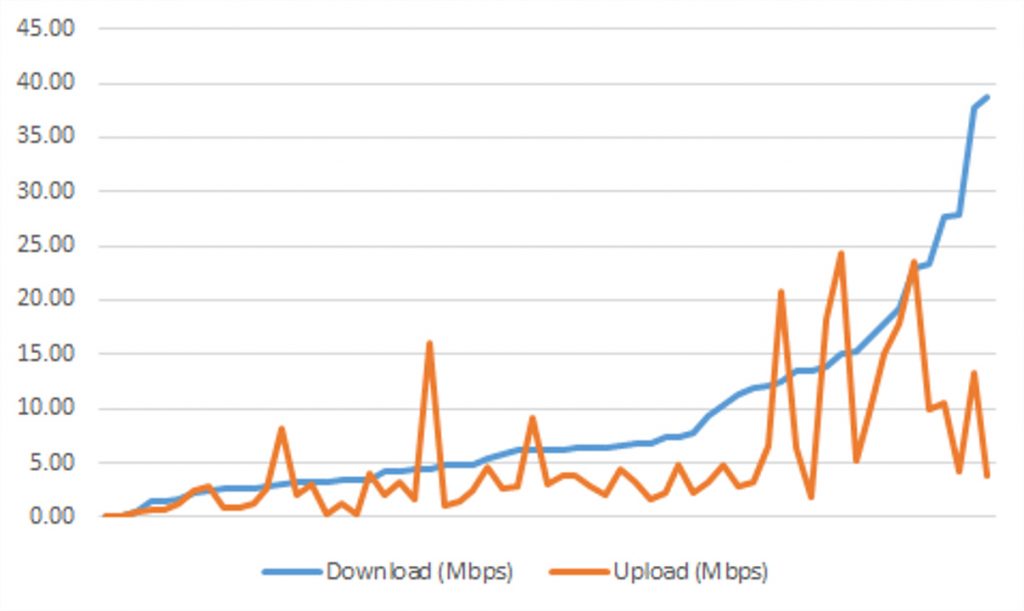
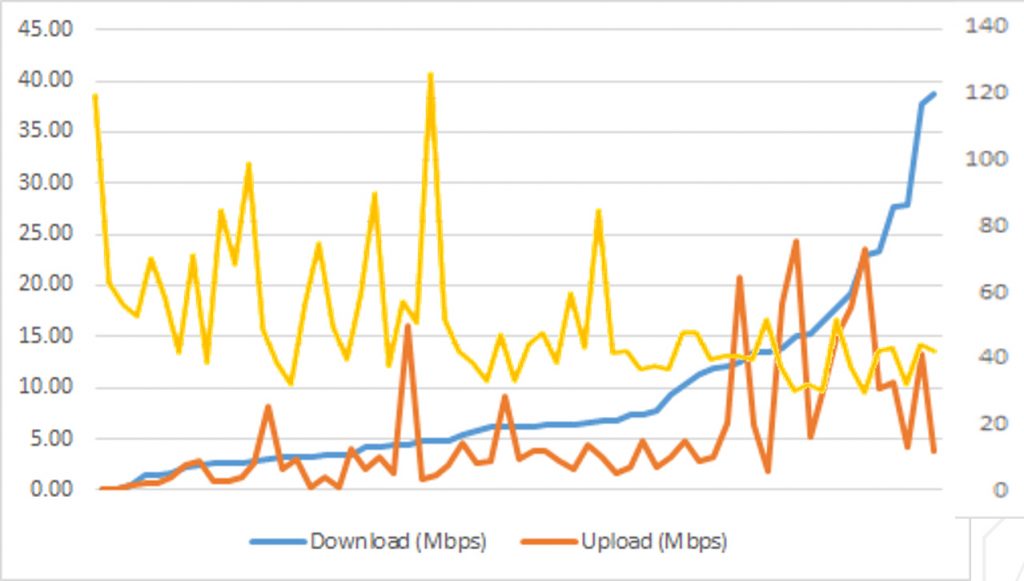
Figure 8 shows the download and corresponding upload bandwidth speeds collected from a survey across southern and eastern England, including London. The left hand Y-axis provides scale in Mbps. The histogram is ordered by ascending download speed. Consisting of over 100 tests, using the speedtest.org app on an Apple iPhone 6+ on the Vodafone network the survey measured the native connection speeds.
The survey shows that there is a wide range in the service were observed including 2.75G, 3G, 3.5G and 4G services. The data points represent the average speeds achieved during the candidate tests.
A key observation is that none of the candidate records show anything close to the theoretically available bandwidth for each of the services delivered.
The results also show that there is a wide spectrum of service delivered, even in built up areas and that upload speed does not appear to be a function of download speed.
Figure 9 overlays the latency for each test, with the right hand side Y axis providing the scale of latency in milliseconds. It is significant that latency is also shown to be variable and cannot be relied on as being a set value at any given download speed.
The higher values for download speed, above 10 Mbps see the latency reduce to 50 ms and below and in many cases even below 40 ms. However, the observations also show that latency can vary to over 100ms especially on slower bandwidth connections.
The 2018 annual review by Opensignal found that 4G coverage is now highly accessible in the UK with an average of over 75% connections being served on a 4G network. However, even though the connection maybe 4G, the network may scale the connection back to a lower standard connection to alleviate capacity or performance issues in their network. Consequently, at certain times 3.5G or even 3G is still necessary.
Consequently, it is necessary to consider how the UX for a website is delivered at different bandwidths as your website may be accessed across slow performing network connections.
Can 5G Help?
As the new kid on the block all of the talk and hype is about 5G. It is undoubtedly a technology with considerable potential to change how many services are delivered and as an enabler for new services. 5G boasts very high bandwidth potential with latency as low as 1ms but little is really known about how it will actually impact on web performance and user experience.
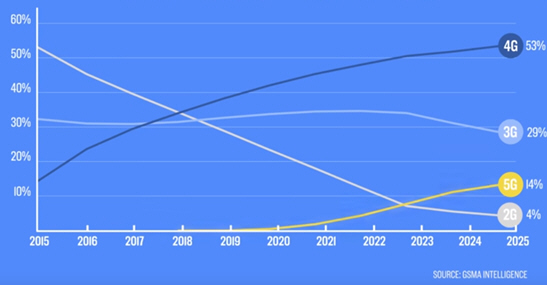
Global Intelligence, as in Figure 10, have predicted that by 2025 5G will account for under 20% of all network connections and that 3G and 4G technologies will be still be critical in delivering 80% of cellular network connections.
This is borne out by Computer Weekly who believe that early adopters can expect to pay 32% premium for 5G but both the roll-out of the technology and acceptance by the general public will delay its replacement of both 3G and 4G.
5G is a promising technology and will open up many new avenues of business opportunity and usage but although it offers almost zero latency, smart devices will have to become considerably more powerful to ensure they are not overrun by the considerable speed up of web content and programming functionality.
What Are the Next Steps
From a cellular network perspective it may be possible to exploit 5G for loading webpages, but there is currently little or no experience of how this could be achieved as mobile devices will also need to become considerably more powerful so that they can process data that is delivered considerably quicker.
Therefore faster networks is currently not the panacea as it will be many years before 5G will be ubiquitous and it’s effects on webpage loading become clearer.
User experience can be improved though by all by aligning UX testing against the major devices and networks used by your cellular connected online visitors. This is not a small task but necessary especially if your target market is predominately based on 3G technology and low power Android devices.
Other technologies are emerging or becoming established that can help with improving user experience on mobile devices and also over cellular networks including HTTP/2, QUIC, Progressive Web Apps (PWA) and Accelerated Mobile Pages (AMP). Each of these technologies can bring performance gains but as with all technologies, their use and implementation requires careful planning and testing.